

If your LinkedIn connection acceptance rate is stuck around 10-15%, your copy is probably fine. Across 13.2 million connection requests studied between May 2025 and April 2026, who was on the list moved acceptance more than every other variable combined. Seniority barely mattered. Adding a note barely mattered. Industry targeting swung results by 2.3x. This guide breaks down the 2026 numbers band by band, shows which levers are worth your time, and walks through building a sharper list in chat before your next send.
Where your number sits: the 2026 acceptance bands
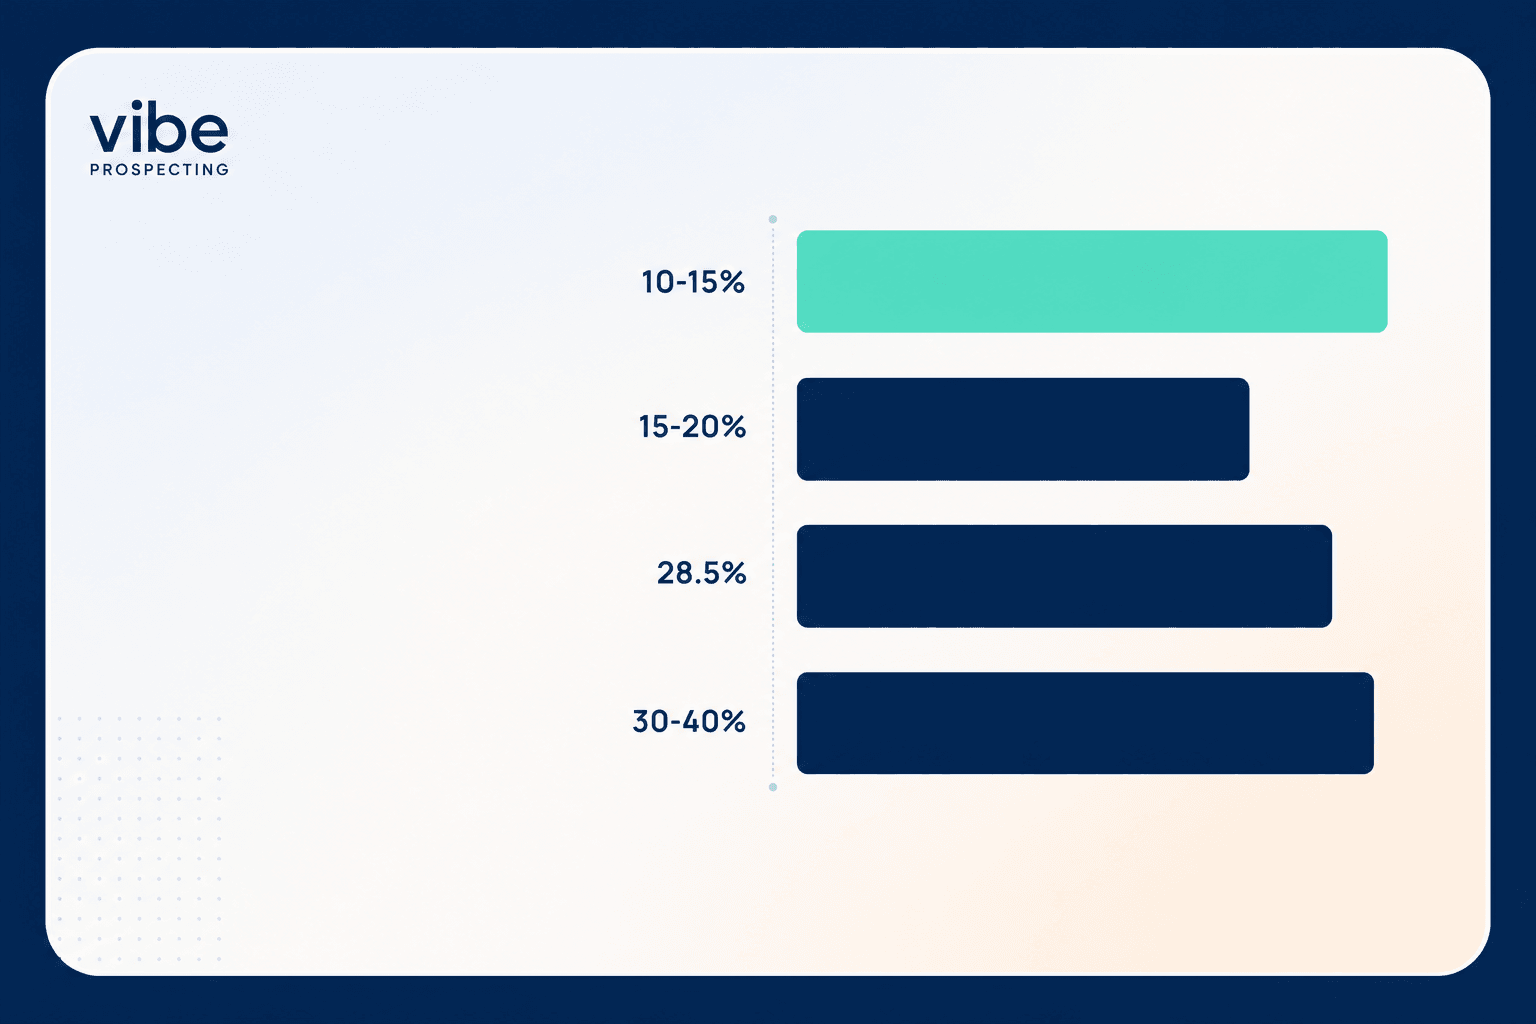
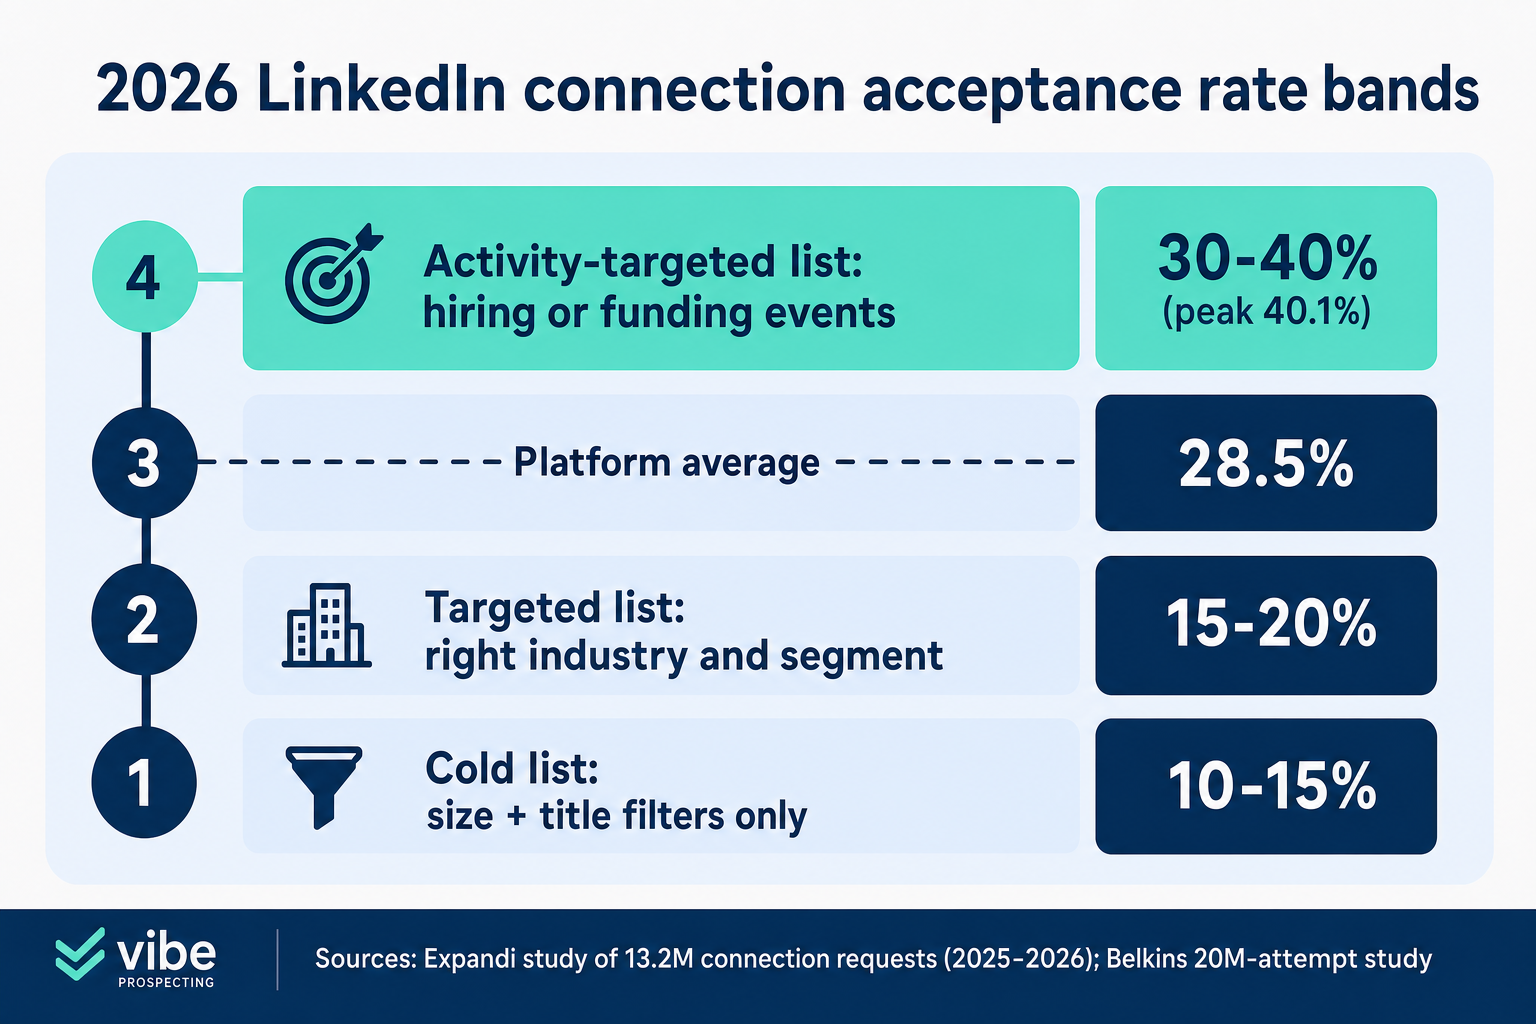
In 2026, a cold list filtered on company size and job title lands at 10-15% acceptance, a well-targeted list reaches 15-20%, and lists built around industry fit plus recent company activity climb into the 30-40% range. The platform-wide average sits at 28.5%, per Expandi's study of 13,218,869 requests across 13,302 accounts.
The four bands
| Band | What it means |
|---|---|
| 30-40% | Top-decile industries with targeting built on real company activity; the best measured segment tops out at 40.1% |
| 28.5% | The platform average, skewed upward by tuned automation users |
| 15-20% | A genuinely targeted list: right industry, right segment, titles you have actually checked |
| 10-15% | The normal result for a cold list built on size and title alone |
And after they accept
- Messages sent after the accept get a 10.4% average reply rate, and that figure held steady across the full study year.
- Replies to connection-request notes average just 3.0%, and fell from 3.5% to 2.2% over the same 12 months.
- Personalizing the first message lifts replies 72%, from 5.44% to 9.36%, per Belkins' 20M-attempt study.
Three things that barely move your acceptance rate
Sender seniority, connection notes, and message copy each shift acceptance by 3 points or less. Chasing them before fixing the list is effort spent in the wrong place.
Seniority is a 3-point lever
- Across 6.5 million requests, C-level senders were accepted 29.4% of the time, managers 27.3%, and junior senders 26.3%.
- That 3-point spread is real but small: you do not need an executive profile to run outbound, you need a credible and complete one.
- Practitioners in the r/gtmengineering discussion rate profile quality as worth roughly 2x on acceptance, more than any title change.
Notes are a reply lever, not an accept lever
- Belkins measured 26.42% acceptance with a note against 26.37% without one. That 0.05-point gap is noise.
- The same personalization applied to the first message after the accept lifts replies by 72%.
- Put the writing effort where it pays: the post-accept message and the follow-ups.
The one lever that moves acceptance 2.3x: who is on the list
Industry segment alone swings LinkedIn acceptance from 17.5% to 40.1% in the 2026 dataset, a wider range than seniority, notes, and copy combined. One practitioner in the source thread on Reddit pegged the working split at 70% targeting, 30% copy.
Acceptance by segment, worst to best
| Segment | Acceptance rate |
|---|---|
| Consumer Electronics | 17.5%, the lowest measured segment |
| Apparel & Fashion | 19.9% |
| Telecommunications | 21.8% |
| Platform average | 28.5% across 60+ industries |
| Staffing & Recruiting | 36.5%, plus an 18.9% reply rate on post-accept messages |
Why size-plus-title lists stall in the bottom band
- A filter like "51-200 employees, VP of Sales" matches thousands of companies with no reason to hear from you, so most requests land on cold eyes.
- Everyone in your space runs the same two filters, which is why crowded segments like B2B software cluster near the bottom of the range.
- What separates the 30-40% band: industry fit, company stage, the tools the company already uses, and recent activity like a hiring spike or a funding round.
The list "needs to be way more specific than just company size and job title." - practitioner consensus in r/gtmengineering
How to read a vendor benchmark without fooling yourself
Both numbers are true at once: 28.5% is the average among users of an automation platform, and 10-20% is what most cold B2B lists actually get. Benchmark against your segment band, not the headline.
What the headline average hides
- The sample comes from an automation vendor's own customers, who skew toward people already tuning their outreach.
- A single average flattens a 2.3x spread across 60+ industries, so it tells you little about your segment.
- The segment-level findings are sturdier than the headline: the industry spread and the small seniority gap both repeat in Belkins' independent 20-million-attempt dataset.
How to benchmark your own team
- Compare against your industry band, not the global 28.5%.
- Treat 10-15% as a list problem with a known fix, not a writing problem.
- Measure acceptance per list tier, so you can see which targeting choices actually pay.
Build the better list in chat with Vibe Prospecting
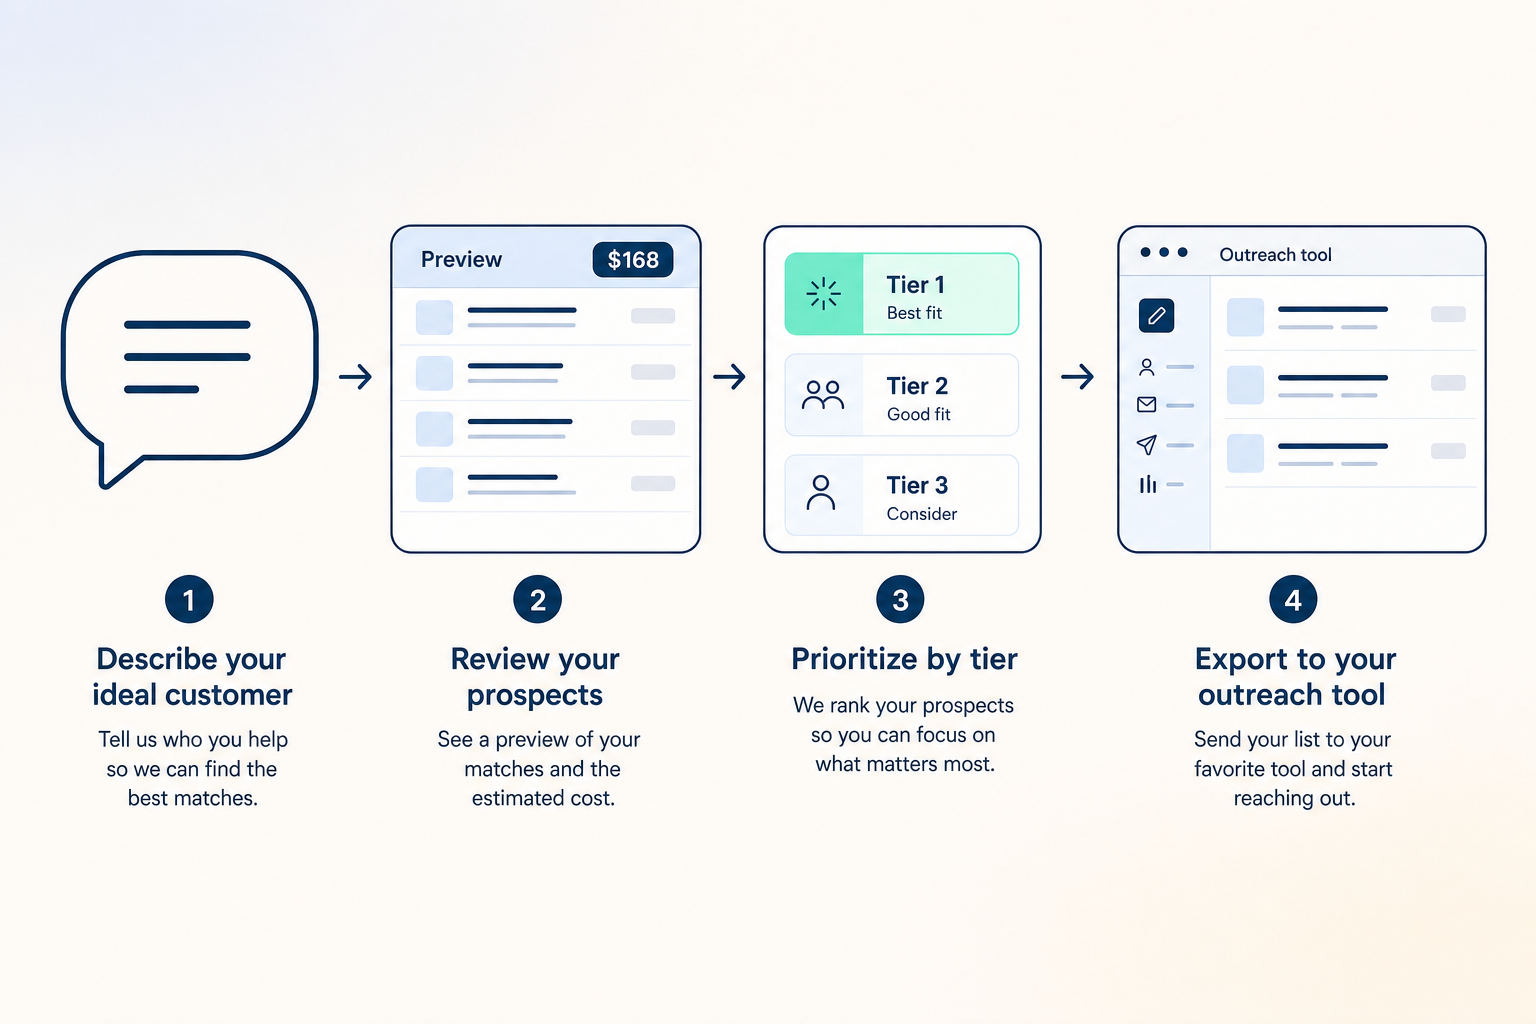
Vibe Prospecting turns the list fix into a conversation: describe who you want in Claude or ChatGPT, preview 5 records with the cost, build up to 1,000 records in a single run, and copy the result into the LinkedIn tool you already use. The data behind it is Explorium Enterprise Business Data: 150M+ company profiles, 800M+ people profiles, and 80+ types of recent company activity such as hiring spikes, funding rounds, and website changes, pulled from 50+ premium sources with 97.8%+ company match accuracy (explorium.ai).
Step one: ask for the list in plain words
Open Vibe Prospecting in Claude, ChatGPT, or the web app and describe the list the way you would brief a colleague: